Development Analysis
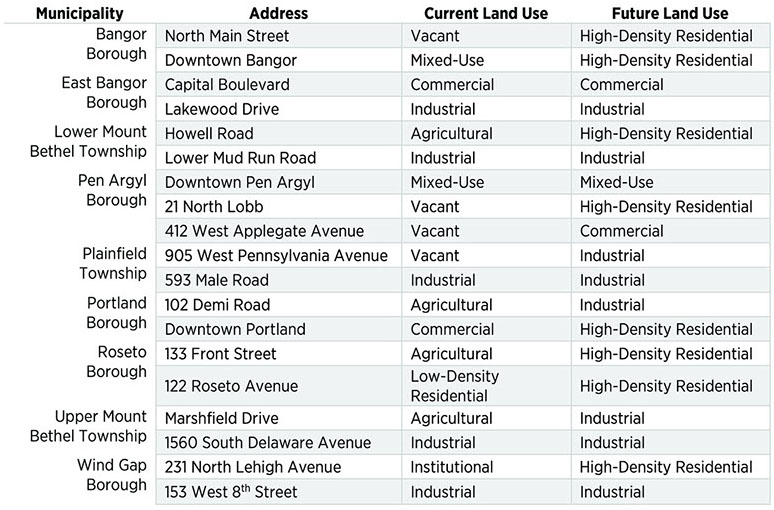
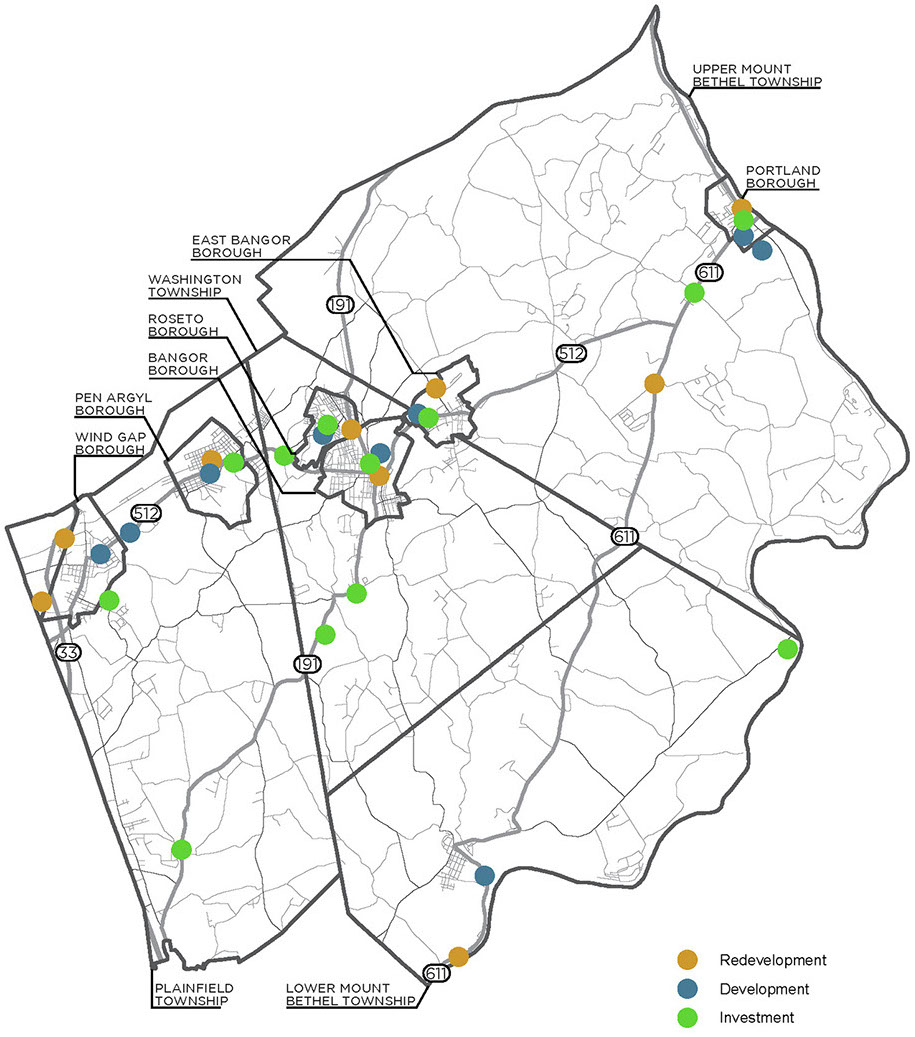
The Slate Belt municipalities were asked to identify a development, redevelopment and investment priority within their community. Development sites are areas that either have no or very little existing development. Redevelopment sites are areas that have existing development, but where the municipalities felt that they had greater potential. Investment sites are places where the municipality wants to see public investment, which generally include community projects, such as park and recreation improvements, trails, or sewer and water infrastructure.
A Development Analysis was performed on the locally identified development and redevelopment sites. This analysis focused on what might be the revenues and costs associated with higher-intensity use of the sites and was based around four scenarios: Existing, Average, High and Case Study. Projecting these different scenarios helps to show the financial impacts of different intensities of development without having a specific development proposal to test. The results are broken out for each of the development sites.
The investment sites were not included as part of the analysis, but will be important to developing the policies, actions and implementation steps of Plan Slate Belt.
DEVELOPMENT SITES
DEVELOPMENT, REDEVELOPMENT AND INVESTMENT
Development Scenarios
Existing Scenario
The Existing Scenario models the revenue and cost currently generated by the property. This scenario serves as a baseline for comparing the other scenarios.
Average Scenario
The Average Scenario models what the tax revenue and cost would be if it had the same per-acre value as the average for that type of land use within the given municipality. This portion of the analysis helps us understand whether or not the property is currently underperforming, on par with or overperforming similar properties within the municipality.
High Scenario
The High Scenario models what the tax revenue and cost would be if it had a similar value to high-value property that already exists within the municipality. We used properties at the 75th percentile of value per acre to model High Scenario because properties with higher values per acre were generally smaller than the properties being tested as part of the analysis.
Case Study Scenario
The Case Study Scenario serves as a comparison to the High Scenario to see what the revenue and cost an improved property may have. This model uses similar recently completed projects in Northampton County that have been assessed to have similar development and redevelopment projects desired by the Slate Belt communities.
Development Limitations
Revenue
All the jurisdictions derive revenue from multiple sources, but it is difficult to model how non-property tax revenue, such as fees, grants, local sales tax or local income tax, would be affected by development. To keep the model clean and remove potential variables, such as trying to project the income of future residents, revenue was only calculated based on property taxes.
Cost
Unlike revenue, costs tend not to be greatly affected by a specific development or redevelopment project and can be, with certain limitations, modeled by averages. However, such averages cannot anticipate the impacts and associated costs from high-impact land uses, such as transportation, warehousing and logistics.
Methodology
The Development Analysis involves calculating the revenues and costs to determine the best estimate of how much the land in question is worth under different levels of development. The data used for this analysis were assessed land value, municipal tax rate, school district tax rate, county tax rate and acreage of land uses within each municipality.
The Average-Cost Technique using Proportional Valuation was employed. This method assumes that assessed property values are directly related to public revenues and service costs and uses average revenue and cost calculations to estimate the impacts of development proposals. Typically, this impact is calculated per unit of housing or square footage of building area. Because residential and non-residential land uses are recorded differently in local and regional databases, acreage was used as the common denominator to calculate revenues and costs for each type of land use.
The estimated revenue and cost for each land use was calculated for each municipality, school district and county. Costs were assumed to be the same regardless of the development scenario, unless the land use changed from what it is today. With the school districts, costs were adjusted based on the potential for development or redevelopment to include children.
Revenue Estimate
Current land use, property tax rate, total assessed value (assessed land plus assessed building value), land use codes and acreage were pulled from the county parcel data. The land use codes were grouped into eight general land use categories to simplify the analysis. This data was used to estimate revenue per acre.
For the Existing Scenario, the existing property information, including land use, acreage and assessed values, for each of the sites identified by the municipalities was collected and used to calculate estimated revenues for each property.
For the Average Scenario, assessed acreage and assessed values were totaled for each land use for each of the ten municipalities. Total revenue for each land use was estimated by multiplying the millage rate by total assessed value, producing an estimated revenue for each land use. The estimated revenue per land use was divided by the total acreage for each land use, producing an estimated average revenue per acre of land use. The resulting average revenues per acre were used to calculate the Average Scenario.
For the High Scenario, the total assessed value per acre was calculated for all the properties within each land use. The property with the three-quarters estimated total value per acre was selected to estimate potential revenue. At this threshold, 75% of properties within that land use had a per-acre value below the selected property, and 25% had a value above the selected property—providing a good sense of what a high value property might generate in revenue using the municipality’s own data.
For the Case Study Scenario, properties were selected from around Northampton County that fit the development or redevelopment scenarios for each of the identified sites. These case studies were recently completed, high-profile projects that had updated property assessment data in the county’s database. Similar to the Existing Scenario, the total assessed value and acreage of the case studies was used to calculate estimated value per acre. This value was then used to estimate revenue generated if development or redevelopment of the site in the Slate Belt would have the same per-acre value as the case studies used.
Cost Estimate
The land use and acreage were reused from the Revenue Estimate and combined with information from the current fiscal year budgets to estimate average cost per acre.
For municipalities, total expenses were broken up into the general expense categories identified in the municipality’s budget. These expense categories were sorted based on whether the expense would generally apply to each of the eight land uses, before being broken up into a per-acreage calculation for each general expense. These per-acreage calculations were combined to generate the estimated total expense per acre for each land use. This data was used to estimate municipal costs for each of the development scenarios.
The cost estimate for school districts followed a similar methodology that was modified to account for the number of students. The budget for each of the school districts was divided by the total number of students in the district. Because districts do not report the number of students for each municipality, an estimate was created based on U.S. Census information on number of people under the age of 17 living in each municipality. This estimate was made by creating a ratio between total population under 17 and number of students enrolled in the district. The number of students was proportioned based on the percentage of the population under 17 for each municipality.
Estimated total municipal expense was calculated by multiplying the estimated number of students by municipality and the average expense per student. This total estimated expense was divided up by land use for only the land uses that have residential populations (Low-Density Residential, High-Density Residential, Mixed-Use and Agriculture). The individual municipal costs per acre of land use were averaged to create an estimated cost per acre of land use for the school district as a whole. Averaging the cost per acre also had the benefit of accounting for population density of students, with higher-intensity residential development having a higher-estimated cost per student. This process was repeated for each of the three school districts and used to estimate the school district costs for each of the development scenarios.
Results: Existing and Average Scenarios
Nearly all land uses did not earn more than their cost under either the Existing or Average scenarios. These results are unsurprising because the municipalities and school districts in the Slate Belt, as well as Northampton County, all derive their revenues from a variety of sources. Property taxes usually make up the largest single source of revenue but do not, in general, earn more than their cost in either their Existing or Average scenarios, regardless of the type of land use.
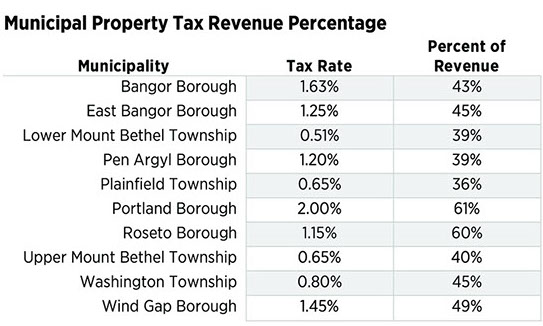
The exceptions to this generalization are if a property has a particularly high existing value, such as Portland’s downtown, or if a jurisdiction derives a higher percentage of its budget from property tax revenue, such as Roseto Borough or the school districts. Downtown Portland actually performed worse under the Average Scenario, showing that it already has a relatively high per-acre value when compared with other areas of the Borough. Both boroughs rely more heavily than the other municipalities on property tax revenue (approximately 60% versus an average of 44% for the Slate Belt communities), and performed much better than other communities in the Average Scenario-indicating even middle-income housing will have a positive effect on municipal finances.
The school districts also brought in a much higher percentage of their budget from property taxes, and therefore, made money on most types and intensities of development. However, the school districts did struggle with agricultural land uses, likely due to low property values per acre, and therefore, lower revenue per acre than other land uses with students.
Nearly all communities saw an improvement under the Average Scenario, indicating most of the sites selected are currently low value and good locations for development or redevelopment from a financial standpoint.
Results: High and Case Study Scenarios
All the sites showed a significant improvement in the High and Case Study scenarios. Interestingly, the High Scenario, which used data from the individual municipalities, showed the largest improvement. This indicates that Slate Belt communities could see significant financial improvement from bringing some of their existing properties more in line with their own high-value properties.
Municipalities saw their highest revenue come from High-Density Residential or Mixed-Use because of the high property value per acre and the relatively lower cost of providing municipal services to denser areas. School districts saw the highest revenues from non-residential districts, where the lower property value per acre was more than offset by the lack of cost from not having any residential population.
Several sites still did not have revenue that exceeded their cost under the Case Study Scenario. These sites included high-density residential development in Bangor Borough, as well as industrial development in Portland Borough and Plainfield Township. All three did see a significant narrowing of the gap between revenue from property tax and cost per acre, but improving each of these sites to meet their development scenario would require infrastructure improvements that are not currently reflected in the cost calculation. More detailed financial modeling should be examined associated with development of these properties.
Specific Land Uses
High-Density Residential
While high-density residential was good for municipal tax revenues, school districts had a harder time with these districts. Both are likely due to the density of the district, which allows for cost savings on the municipal side, but also means a higher number of people and larger number of children. However, the low number of children per household in the Slate Belt means that even most high-density residential areas made money for their respective school districts, making these areas an overall positive influence on the community’s finances.
Vacant
Vacant properties have an extremely high cost to municipalities, school districts and the county. Their low property value compared to other land uses means that there is a significant loss of potential income. Because several of the vacant sites identified for this analysis are relatively large, this can have significant financial impacts. It is in everyone’s best interest to return these properties to productive use.
Agriculture
All agricultural land has significant cost to municipal tax revenue, due to comparably low property values per acre and the large amounts of agricultural area in each of the townships. While the actual cost to service farms is likely much lower than this analysis predicts, because farms require fewer municipal services per acre than other land uses, residential development in agricultural areas starts to significantly increase the cost of providing municipal services in these areas.
Warehouses and Industrial Development
Municipalities generally do not make much money from warehouses or industrial development. These land uses typically have fairly low property value per acre and do not produce as much revenue as other potential land uses. Furthermore, the cost estimate used for this analysis did not take into account the additional infrastructure costs of industrial development, including road improvements and additional wear and tear on existing roadways. Detailed financial, infrastructure, traffic and other impact analyses should be conducted associated with any industrial or warehouse development so that communities have an accurate understanding of the costs associated with such development.
Simplified Land Uses
- Low-Density Residential
- High-Density Residential
- Mixed-Use
- Industrial
- Commercial
- Agricultural
- Vacant
- Institutional
Institutional land use was assumed to not generate revenue because it represents schools, churches and non-profit entities that do not pay taxes.
Summary
The sites chosen by the Slate Belt communities for the Development Analysis are good case studies for the area. Most of them are currently under-performing on tax revenue when compared to the average for their type of development within each community. Developing or redeveloping these sites significantly improves the revenue-cost balance, with many sites potentially having significant positive effects on their municipal revenues. Surprisingly, high-density residential development tends to have the best impact on municipal revenues, while warehouse and industrial development underperformed expectations.
Slate Belt communities should carefully consider the financial impacts of different types of development when crafting the policies, actions and implementation steps for Plan Slate Belt.
CLICK HERE FOR PRINT VERSION
Consultant, site maintained by Lehigh Valley Planning Commission