
demographic analysis
The Slate Belt is an area of 35,981 diverse people—young and old, wealthy and impoverished, working and non-working. Understanding the different types of people living in the Slate Belt communities is a key component in enabling Plan Slate Belt to identify their needs and how those needs could be addressed.
The Demographic Analysis paints a picture of who is living in the Slate Belt area and how many more people are projected to come by 2040. These demographic data points, once compared to the data analyses to follow, will enable Plan Slate Belt to formulate goals, policies and actions to drive investment and make decisions that best serve the Slate Belt communities.
Age
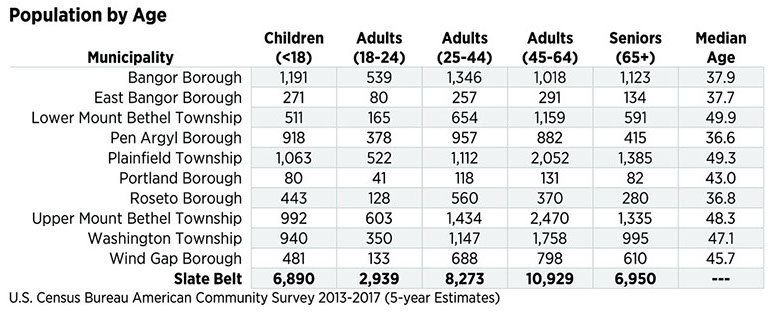
The Slate Belt area is home to a population of diverse ages. Children under 18 make up about one-fifth of the population, and young adults ages 18-24 make up 10%, indicating that many leave for school or to start a career. The largest age group consists of adults between the ages of 45 and 64, and overall, the population of adults age 25 and above make up the vast majority (71%) of the population. The number of seniors (19.2%) is slightly higher than that of Northampton County (17.8%), suggesting a higher need for healthcare for older residents.
Growth
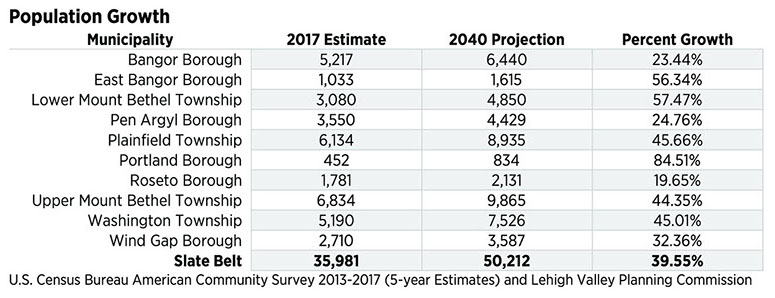
The Slate Belt is home to approximately 12% of Northampton County’s population—a small percentage considering the size of the area. Despite minimal investment and slow population growth in recent years, the Slate Belt is anticipated to experience a 40% increase in population by 2040. Based on past and current trajectories of regional population growth, the Slate Belt’s expected population increase is likely a result of proximity to the rapid growth of the overall region and development that is following the Route 33 corridor northward.
Birth Rate
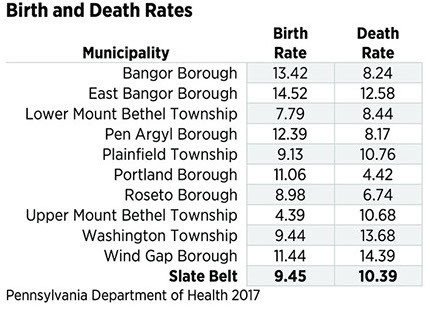 The Slate Belt has an overall birth rate of nearly ten children per 1,000 people per year (9.4). This rate is about half that of the national birth rate (18.5 births per 1,000 population in 2016). While Bangor and East Bangor boroughs have relatively high birth rates for the Slate Belt area, indicating a younger community, Upper Mount Bethel Township has a birth rate significantly lower than all other Slate Belt municipalities.
Death Rate
The Slate Belt has an overall death rate of nearly 11 deaths per 1,000 people per year (10.4). This rate is 33% higher than that of the national death rate of 7.8 per 1,000 people per year (2016 data). With this factor being higher than the birth rate of the sub-region, all of the projected population growth is expected to be due to in-migration, rather than resident couples settling down to start a family. This prediction could change if the Slate Belt becomes a more attractive place for young families.
EDUCATION
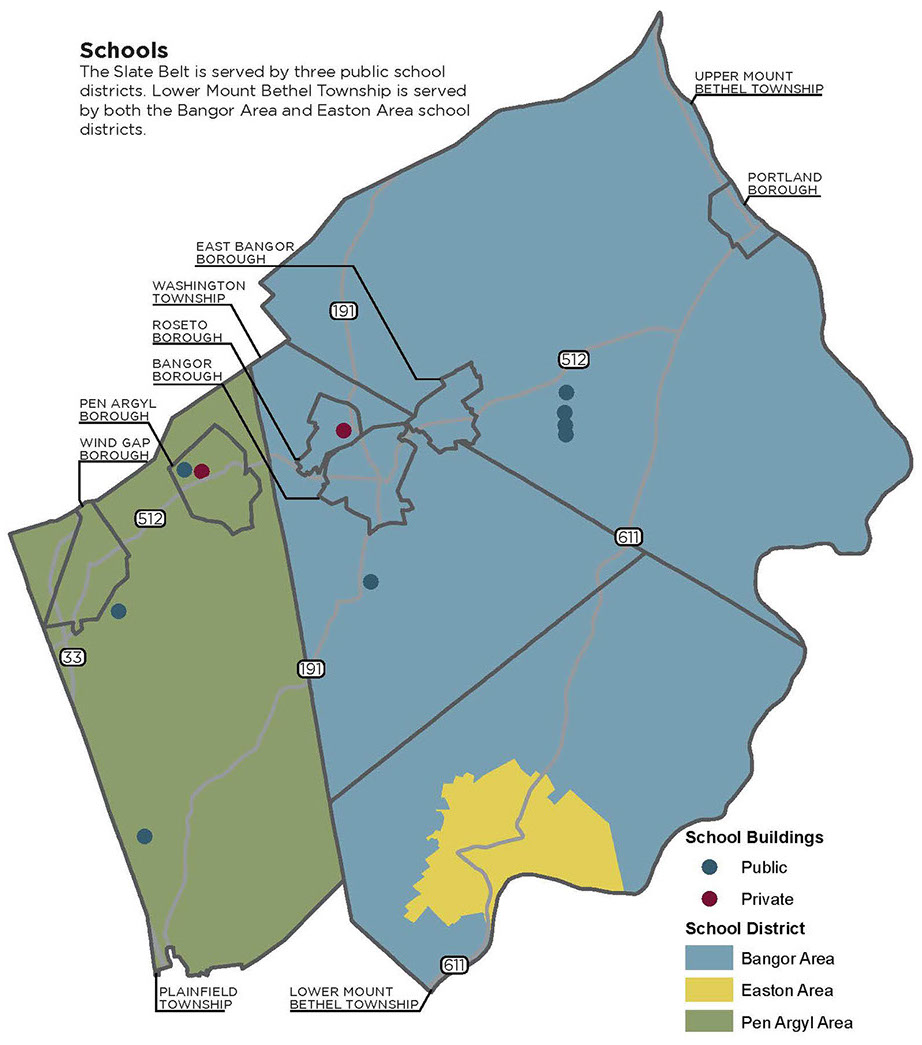
Schools
The Slate Belt is served by three public school systems and two private schools. Only a small portion of students from Lower Mount Bethel Township attend the Easton Area School District—the exact number is unknown because the Easton Area School District does not report the portion of students from each community.
Student Food Subsidy
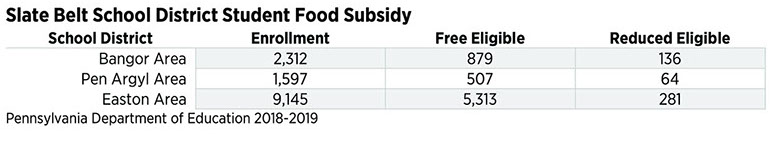
Approximately one-third of the student body within the Bangor Area and Pen Argyl Area school districts is eligible for Free Lunch.
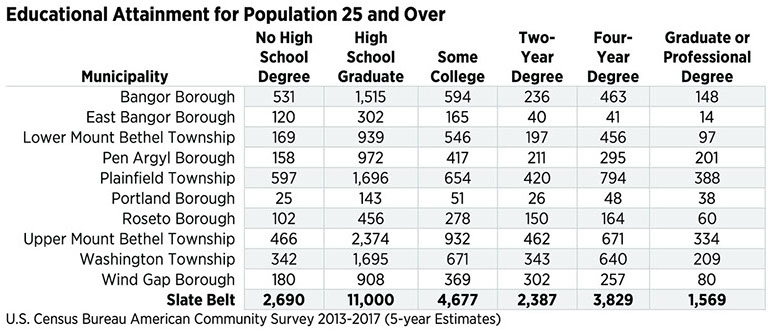
Attainment
High school graduation is the highest level of education for a majority of Slate Belt residents, with about 48% of the Slate Belt population having at least some college education. Just over 20% obtained a Bachelor’s Degree or higher, compared to 30% throughout Northampton County. About 9% have an Associate’s Degree, and about 10% did not complete high school.
EMPLOYMENT
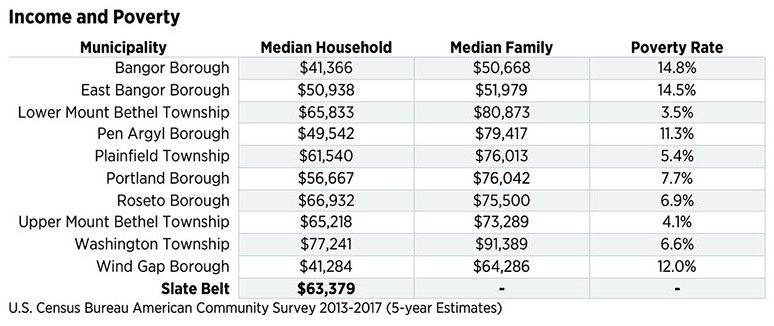
Income
The Slate Belt has an overall median household income of $63,379, close to Northampton County’s median of $65,390. The median household income of Slate Belt communities ranges significantly from a low of $41,284 in Wind Gap Borough to a high of $77,241 in Washington Township. Median family income is higher than household income in every community, ranging from $50,668 in Bangor Borough to $91,389 in Washington Township.
The discrepancy between household and family incomes is caused by the makeup of the household. Family households have two or more people with incomes to support multiple people. Non-family households include single-person households and are likely to contain individuals that are very young or elderly, often with lower incomes than families. A community with a wide disparity between household and family income is likely to have a high proportion of non-family households. Lower Mount Bethel Township and the boroughs of Pen Argyl, Portland and Wind Gap all have relatively large household-to-family income disparities (greater than $15,000).
Poverty
While several Slate Belt municipalities have relatively low poverty rates, Bangor, East Bangor, Pen Argyl and Wind Gap boroughs all have poverty rates significantly higher than that of Northampton County (9.2%). The townships all have poverty rates significantly lower than that of Northampton County, and Portland and Roseto boroughs have lower poverty rates as well. The relation of poverty to certain geographies (e.g., density) may not indicate causation, though it provides information to municipal officials as to what areas may have the greatest need for investment.
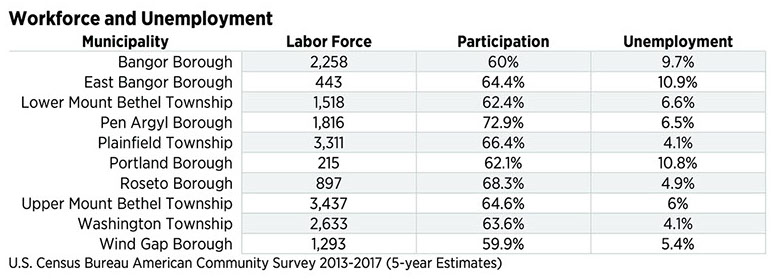
Workforce and Employment
Labor force participation is fairly consistent among the Slate Belt communities, with a slightly larger percentage of Pen Argyl residents being of prime working age. The unemployment rate varies much more greatly between the communities, ranging from a low of 4.1% in Plainfield and Washington townships, to a high of 10.9% and 10.8% in East Bangor and Portland boroughs, respectively. Overall, the Slate Belt has 35.6% of the population not in the labor force, which is mostly made up of school-age people and retirees.
EQUITY
Methodology
Equity refers to whether or not all people in various geographies have access to housing, education, employment and transportation resources that are essential for a high quality of life. An equitable community is more culturally vibrant and economically successful because there are more hands and brains contributing to the area.
An Equity Analysis was done in 2018 to identify what areas of the Lehigh Valley have high or low access to opportunity relative to the rest of the region. The analysis looks at 14 different data points related to housing, transportation, economics and job access, and education. Based on the scoring of these data points, each census tract is given a score from very low to very high access.
Slate Belt
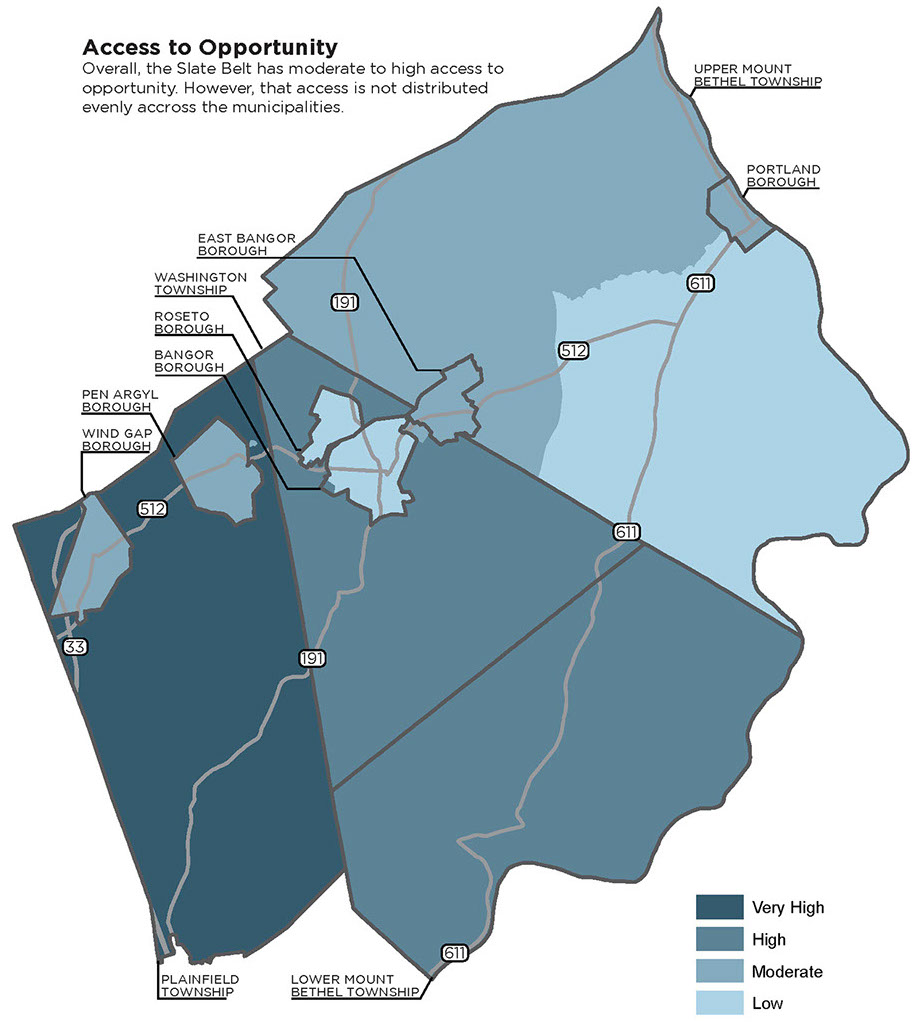
The Slate Belt has moderate to high access to opportunity compared to the Lehigh Valley as a whole. However, that opportunity is not evenly distributed. Washington and Plainfield townships have the highest overall access to opportunity. Lower Mount Bethel Township has high overall access as well, with moderate education access. Bangor and Roseto boroughs have the lowest overall opportunity rate, due to very low Housing and low Education, Economics and Job Access categories. The southeast portion of Upper Mount Bethel Township was also found to have low access to opportunity, due to low levels of access to Housing, Transportation and Education. In comparison, the northwest portion of Upper Mount Bethel Township and East Bangor Borough also had moderate ratings in Economics and Job Access and Education, but high scores in Housing and Transportation opportunity.
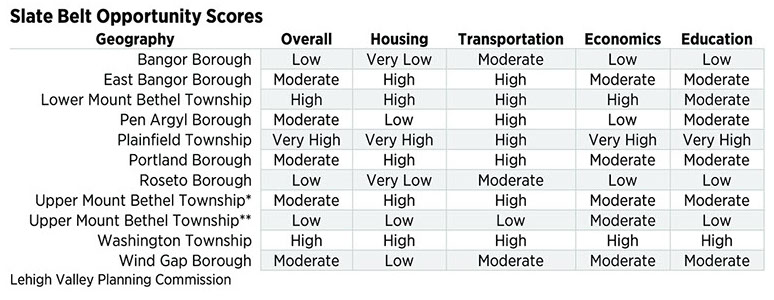
* Northwest half of Upper Mount Bethel Township
** Southeast half of Upper Mount Bethel Township
SUMMARY
The Slate Belt demographic data shows a wide range of incomes and educational attainment among the population. With a birth rate very close to the death rate, the future growth of the Slate Belt will likely be due to in-migration of young and middle-aged workers. The projected increase of 14,231 people by the year 2040 will further diversify Slate Belt residents.
Understanding who lives in the Slate Belt and the components of their lives is critical for Plan Slate Belt to develop goals, policies and actions for the betterment of the area. Providing equitable access to housing, transportation, education and jobs is vital to a more productive and sustainable region. While many portions of the Slate Belt exhibit moderate to high levels of access to opportunity, some denser areas require greater investment to increase access to opportunities for residents. Identifying areas of low opportunity alone is not enough to tell the whole story of the Slate Belt or to determine what investments are needed. However, when combined with the Housing, Land, Economic, Development and Transportation analyses to follow, the demographic data and analyses will yield a pathway toward attaining the desired Slate Belt of the future.
Consultant, site maintained by Lehigh Valley Planning Commission